One business, many sources
Banking, payments, bookkeeping, and forecasting lived in separate systems, with spreadsheets acting as the unofficial source of truth.

THE OPPORTUNITY
BizFinTrack explores a simpler way for small-business owners to see what they have, what is coming, and what they can confidently afford.
THE CHALLENGE
Small-business founders often manage the finances themselves. Banking portals, payment processors, accounting tools, and spreadsheets each show part of the story, but rarely agree on the same picture at the same time.
Before paying a supplier, hiring someone, or investing in growth, they need to understand not just how the business performed last month, but how much cash will actually be available in the coming weeks.
How might we give founders a trustworthy, forward-looking view of cash flow without asking them to become financial analysts?
DISCOVERY
I spoke with four small-business founders about the numbers they checked, the tools they trusted, and the financial decisions that felt hardest. Their businesses and workflows differed, but the same concern kept emerging: whether the money coming in would cover the money going out.
Banking, payments, bookkeeping, and forecasting lived in separate systems, with spreadsheets acting as the unofficial source of truth.
Manual reconciliation created a lag between transactions happening and founders feeling confident in the numbers.
Uncertain invoice timing, recurring costs, and taxes made short-term planning more stressful than historical reporting.
Founders needed a clear, reliable interpretation of their finances so they could make practical decisions.
PRODUCT STRATEGY
I narrowed the first version around the questions founders would return to most often: What is in the bank? What is expected in and out? And will the balance stay healthy over the next 30 days?
A consolidated balance across connected accounts, visible at a glance.
A short, understandable forecast with expected incoming and outgoing money separated.
Recurring expenses and bills surfaced before they become a surprise.
Sent, paid, and overdue payments connected to the cash-flow picture.
Simple transaction categorization, VAT visibility, and exportable data.
A deliberately focused MVP concept—not another full accounting system.
EARLY EXPLORATION
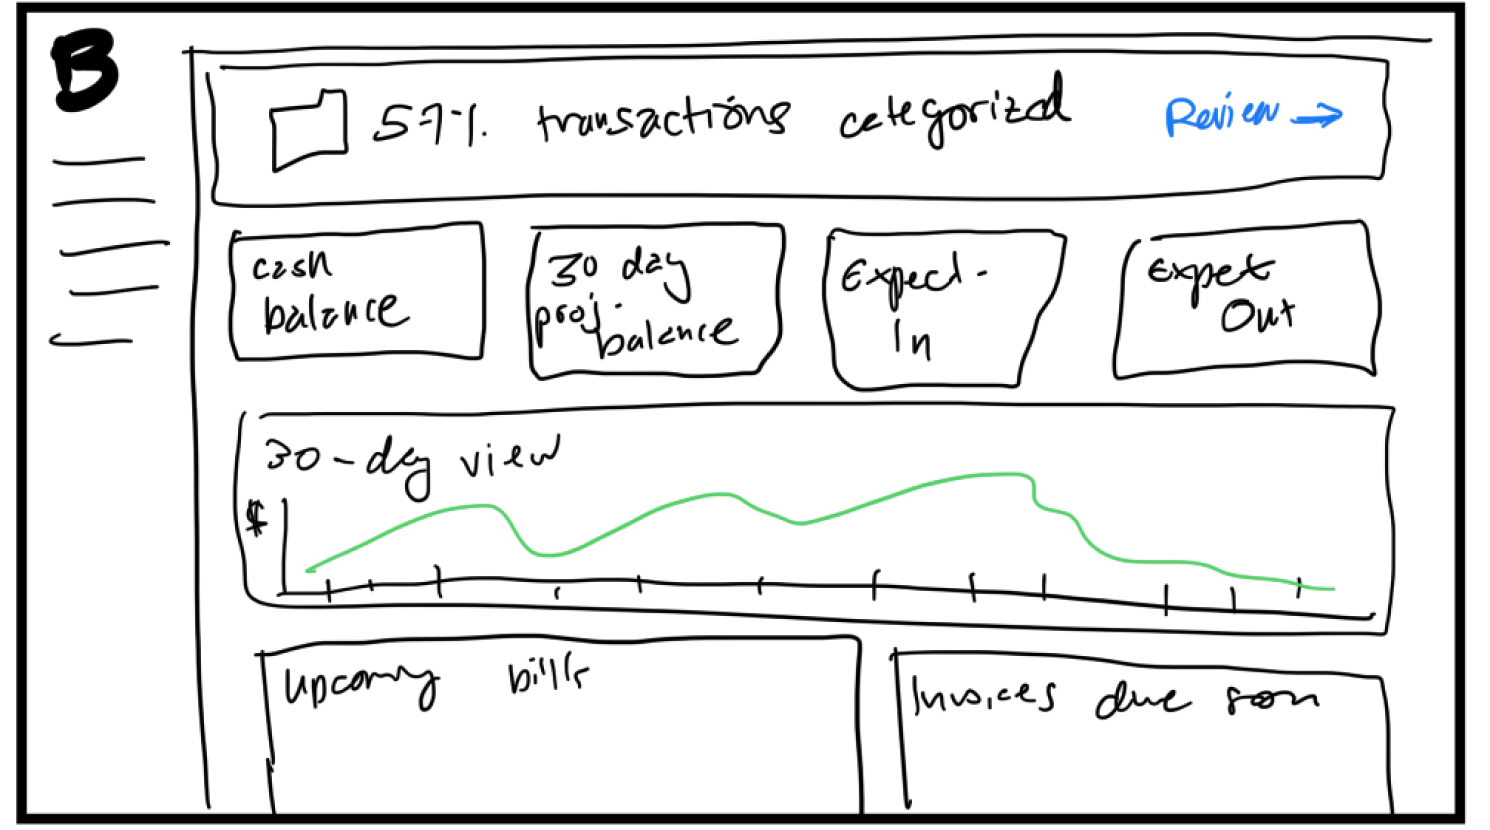
In early sketches, I brought the cash position, 30-day trajectory, upcoming bills, and invoices into one hierarchy. The concept evolved around what needed attention first, rather than simply fitting more numbers on screen.
THE DESIGN
I designed the experience around the daily questions behind the numbers: what can I spend, what am I owed, which transactions need attention, and how trustworthy is this month's report?
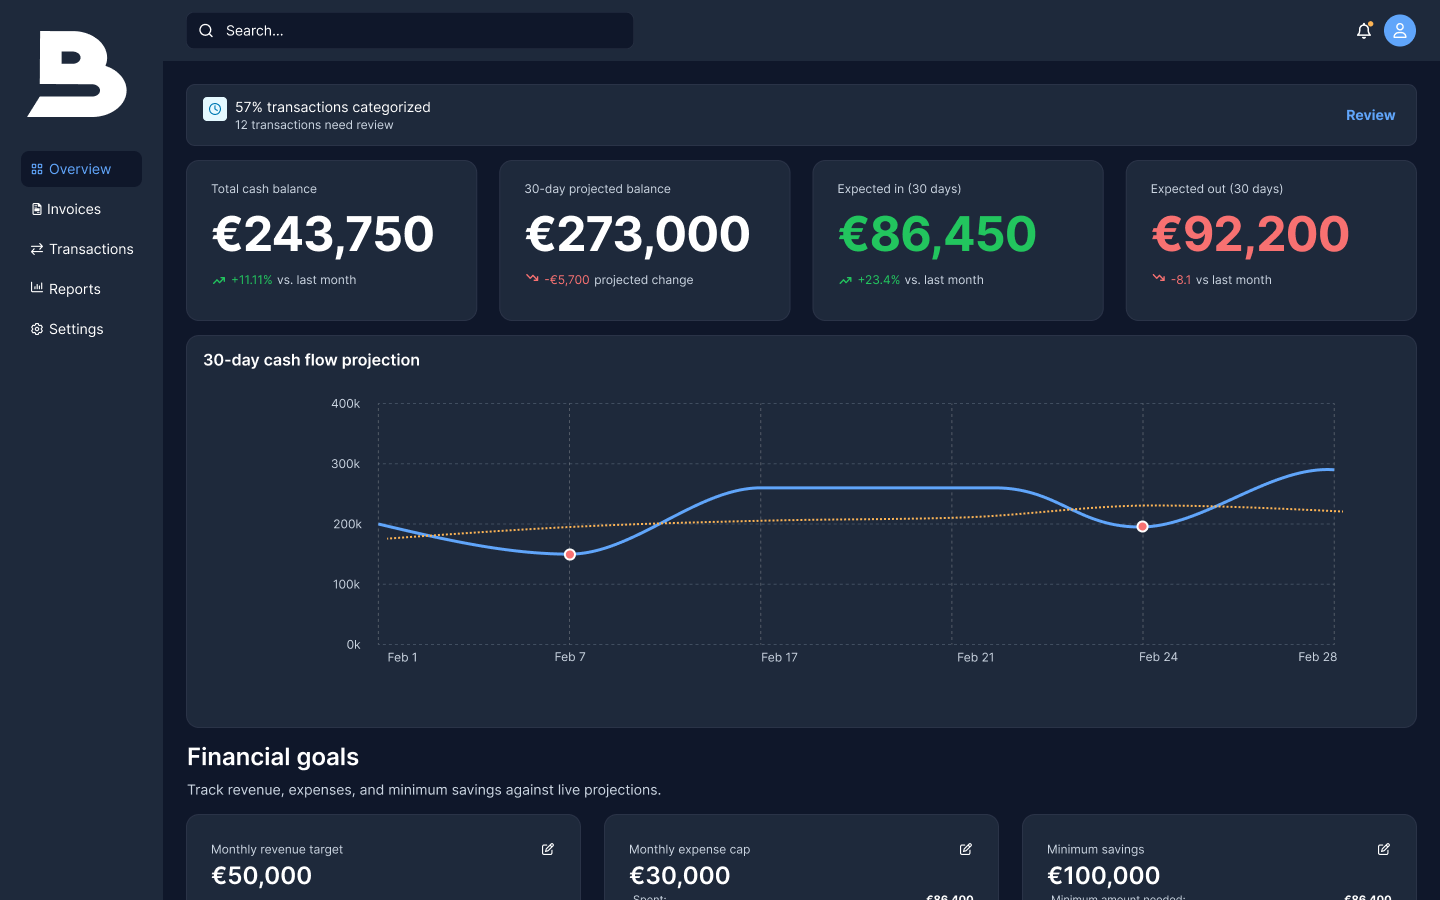
The top level combines total cash, a 30-day projection, expected incoming and outgoing amounts, and an interactive trajectory. Bills, invoices, and editable goals help connect the forecast to real decisions.
The hierarchy answers the immediate cash question before inviting deeper analysis.
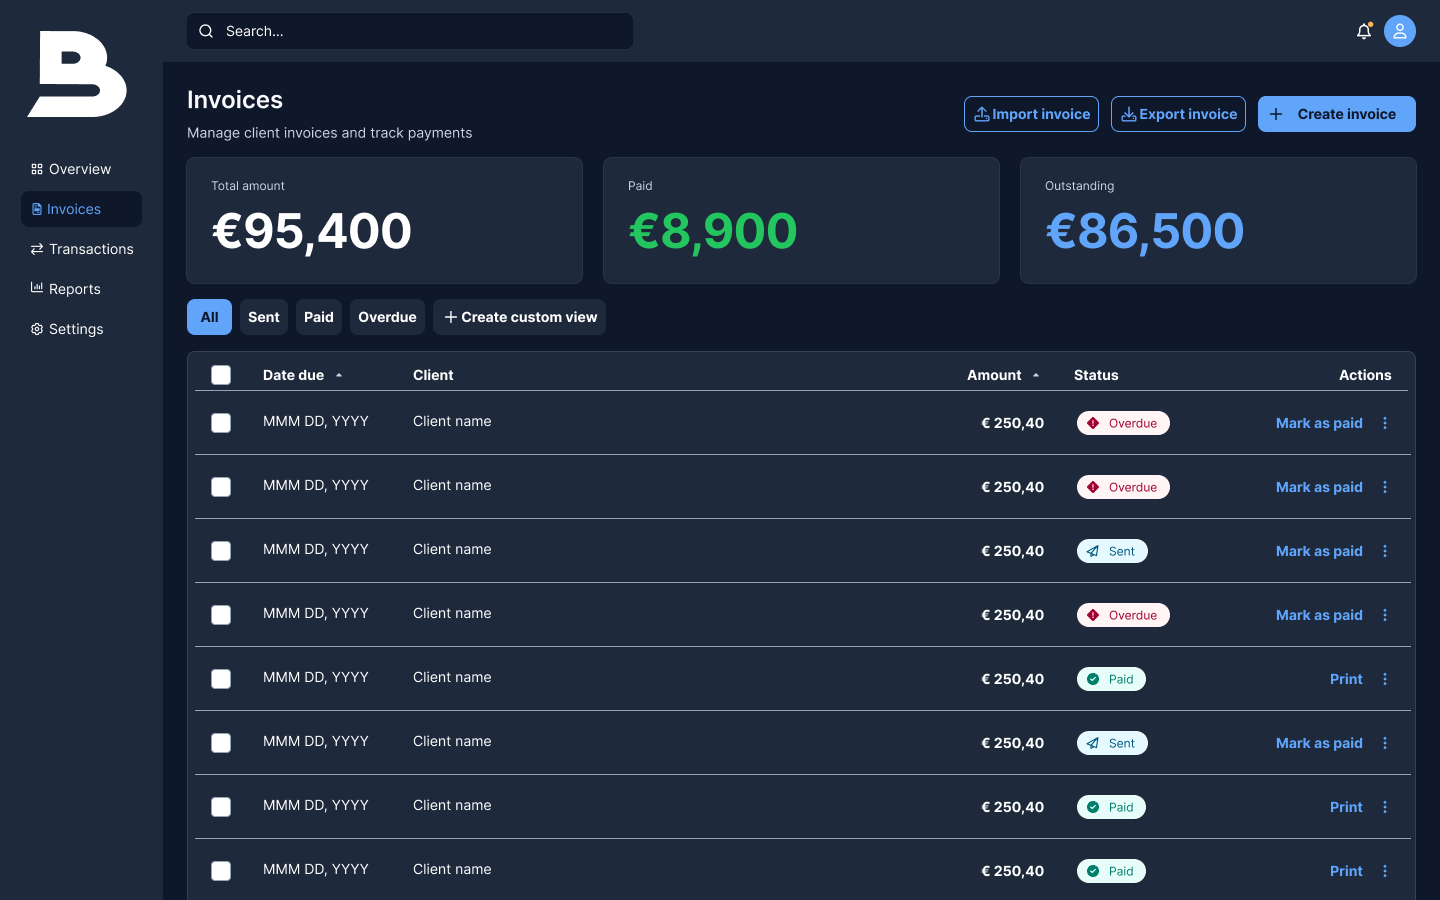
Summary figures separate paid from outstanding amounts. Status filters and sortable columns make it easier to find overdue invoices, while direct actions reduce the distance between noticing a problem and responding.
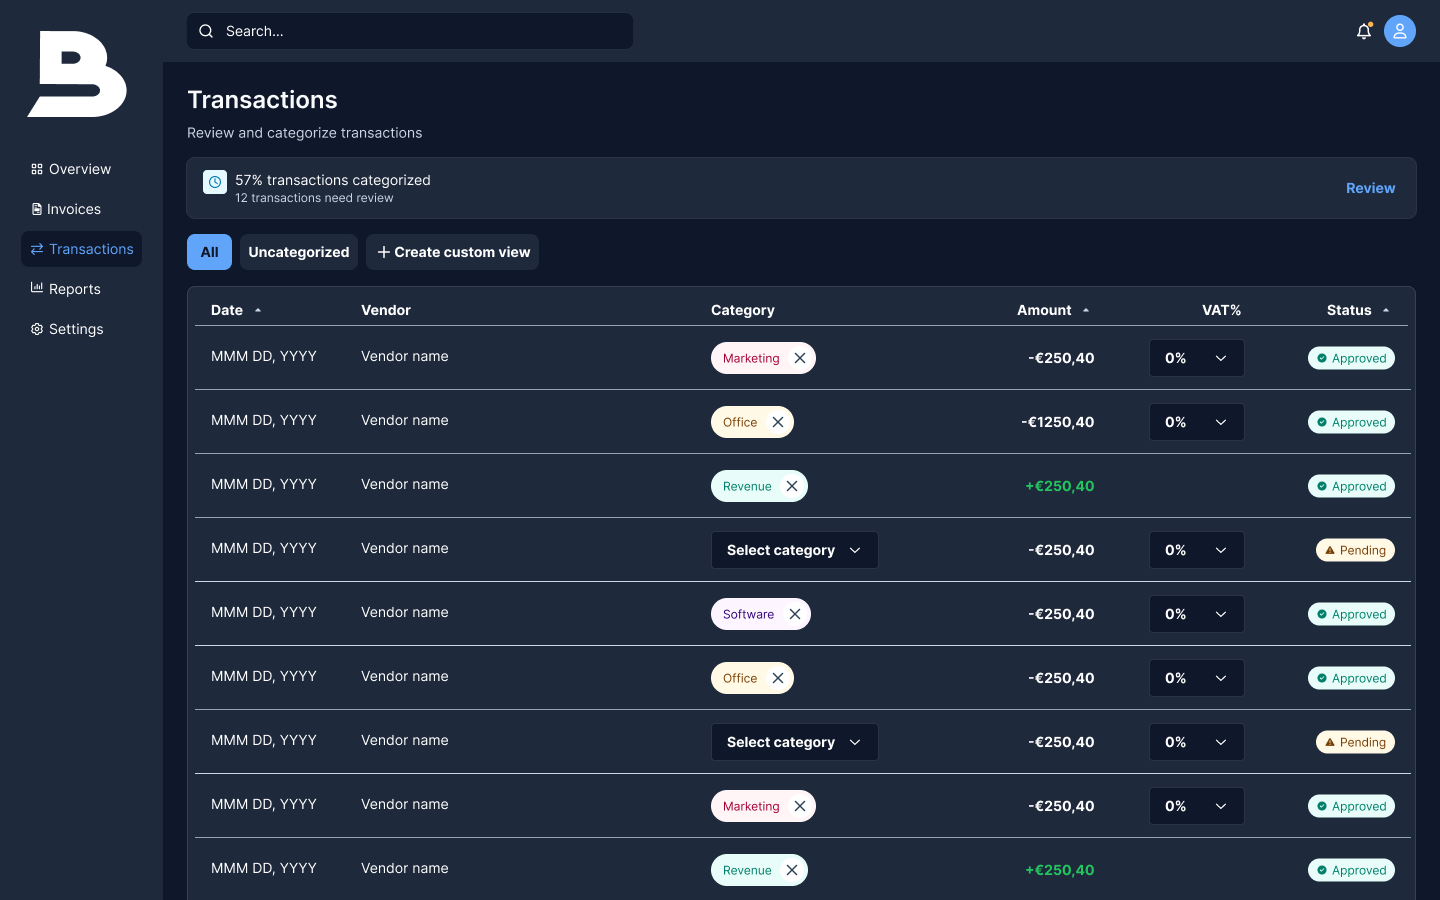
Instead of hiding incomplete bookkeeping, the interface shows categorization progress and the transactions still requiring review. People can filter uncategorized entries, correct suggested categories, and enter VAT percentages directly.
Reports pair a fast summary with profit-and-loss detail and an expense breakdown. When a period still contains unreconciled transactions, its report is visibly labeled provisional, with a route back to the items needing attention.
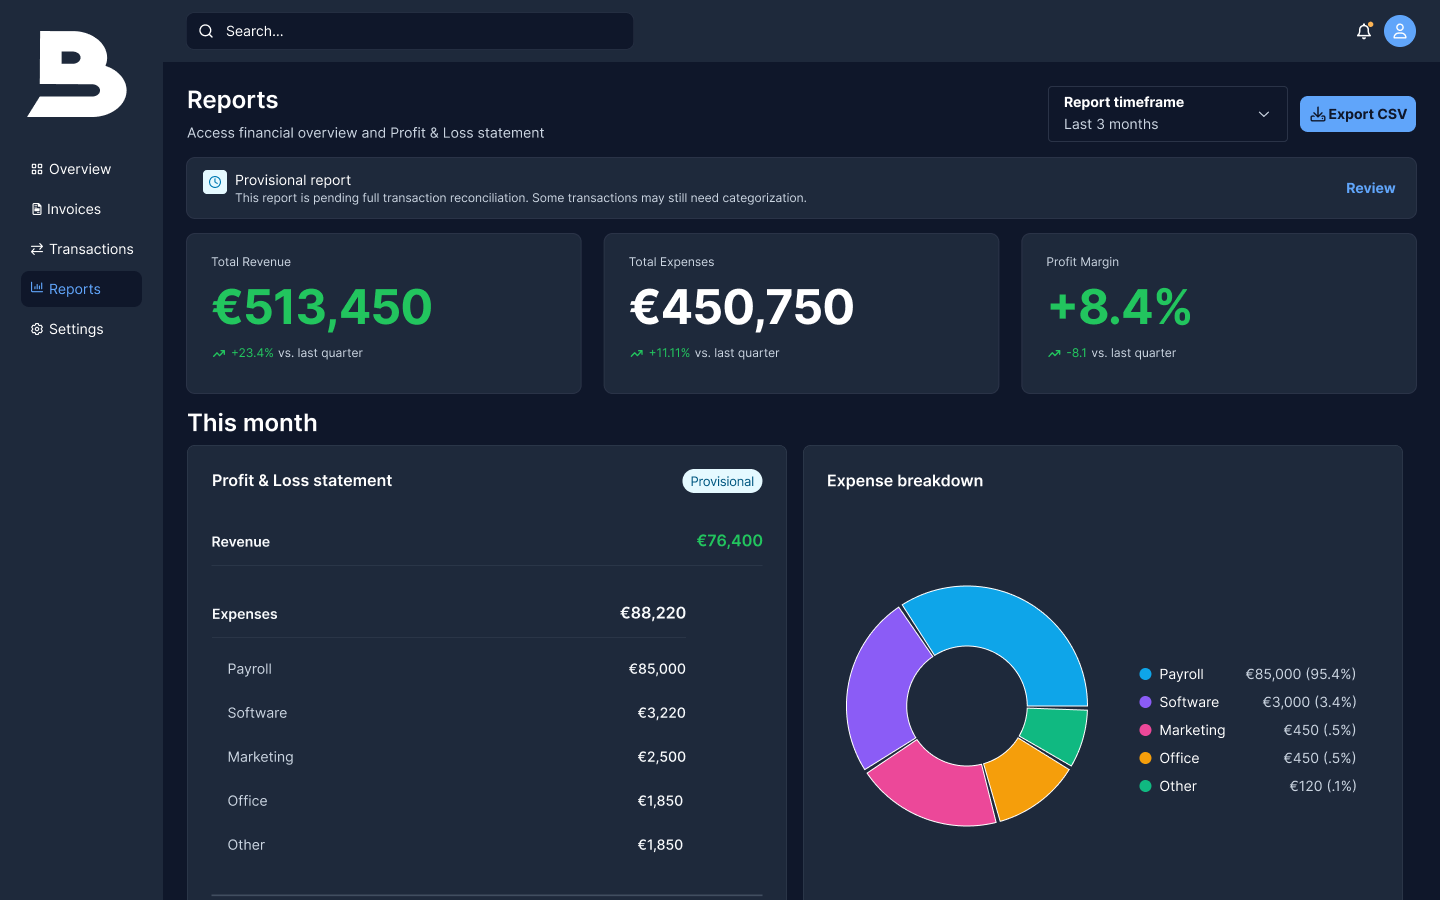
Interface figures and business names are illustrative concept data, not observed financial results.
TRADEOFFS
I limited the initial projection to 30 days and kept estimates distinct from confirmed information. Advanced probability modeling would belong to a later iteration.
I moved away from confusing percentage-overflow treatments in favor of clearer variances and more readable visual comparisons.
Founders need visibility before month-end reconciliation is finished. Exposing categorization progress and provisional states helps them judge how much to trust what they see.
REFLECTION & NEXT STEPS
The strongest design move was defining the dashboard around a decision, not a collection of metrics. Bringing short-term cash flow forward required being honest about what the data could—and could not—say.
If developed further, the next areas I'd explore are more sophisticated payment predictions, scenarios such as whether a business could afford a hire, deeper integrations, and collaboration with accountants. These are future directions, not delivered features.
This is an independent design concept. The screens are prototypes and do not represent a launched product or measured customer outcomes.
Explore more of my product work
Next project: Quarterly Billing